
 - Blog
| Conference: | BSky |
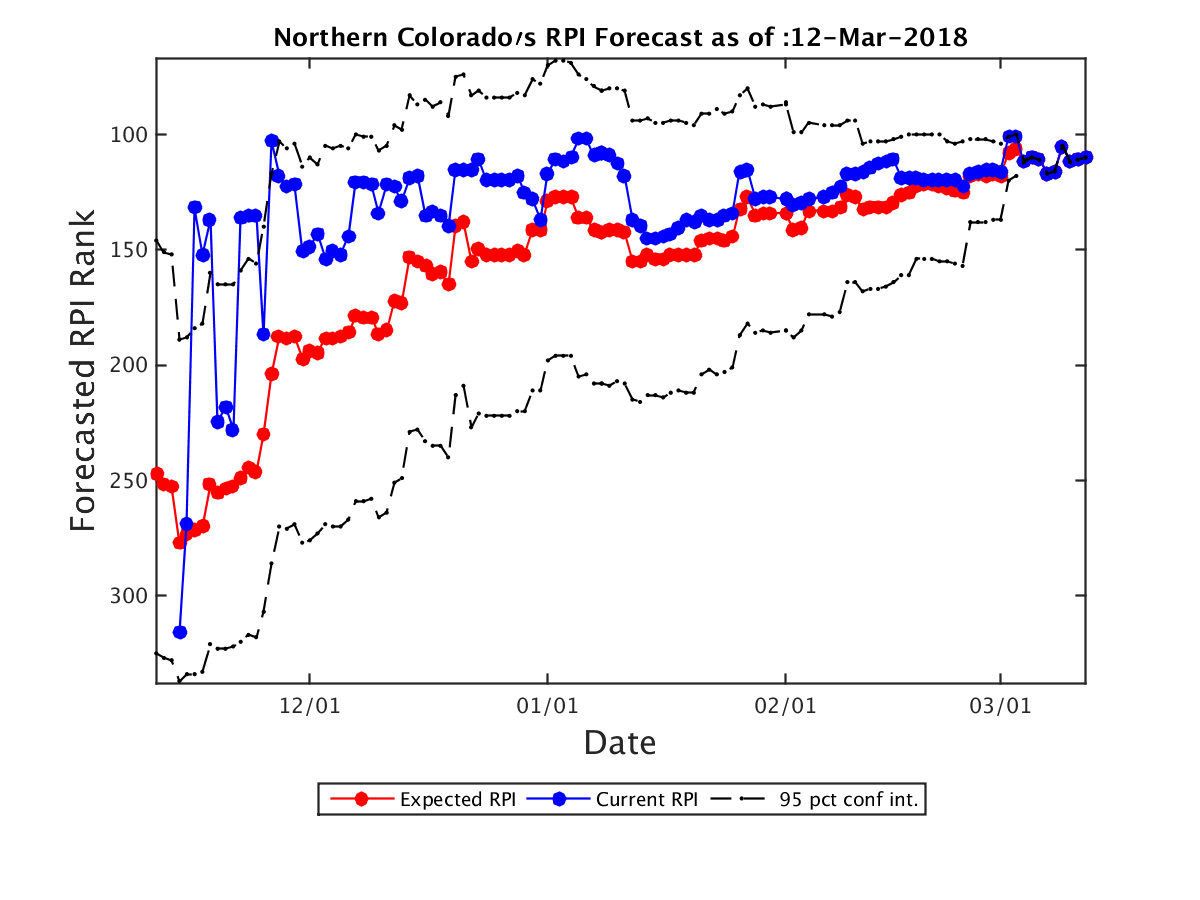
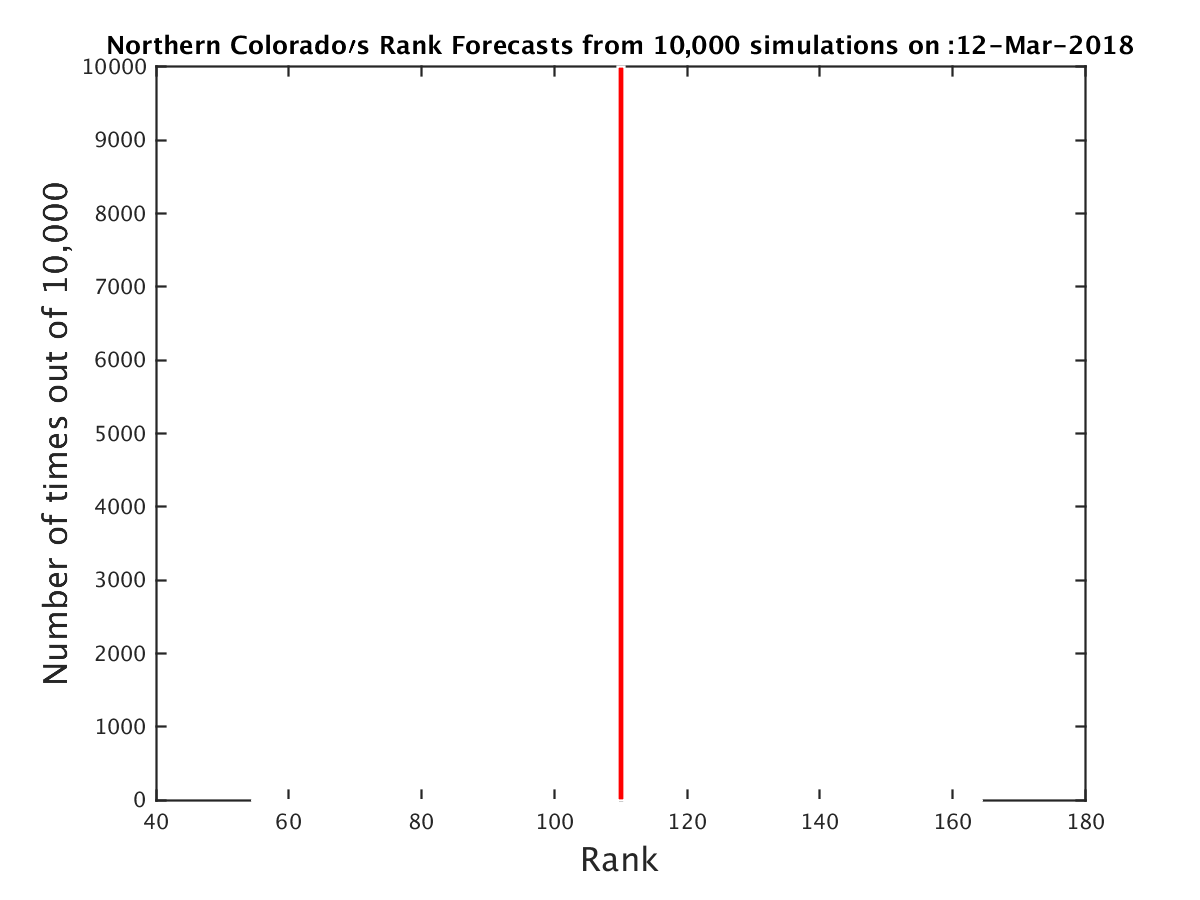
| Expected RPI: | 110.0 |
| Current RPI: | 110 |
| Expected SOS: | 181 |
| Current SOS: | 181 |
| Current Record: | 19-12 |
| Expected Record: | 19-12 |
| Current Conf Record: | 13-8 |
| Expected Conf Record: | 13-8 |
| Expected Record vs RPI 1-25: | 0-0 |
| Expected Record vs RPI 26-50: | 0-0 |
| Expected Record vs RPI 51-100: | 2-4 |
| Expected Record vs RPI 101-200: | 5-6 |
| Expected Record vs RPI 200+: | 12-2 |
| Current OOC Record: | 6-4 |
| Expected OOC Record: | 6-4 |
| Expected OOC RPI: | 100 |
| Expected OOC SOS: | 158 |
| Final Record | Expected RPI | Probability |
|---|---|---|
| 19-12 | 110.0 | 100.00% |
| Date | Opponent (Expected RPI) | Conf | Location | Score | Outcome | Prob(W) | Spread |
|---|---|---|---|---|---|---|---|
| 11-10 | Colorado (82.0) | P12 | A | 66-51 | L | 0% | 0.0 |
| 11-13 | UC Davis (102.0) | BW | H | 59-74 | L | 0% | 0.0 |
| 11-17 | Pepperdine (317.0) | WCC | A | 82-84 | W | 100% | 0.0 |
| 11-24 | Youngstown St. (329.0) | Horz | N | 67-80 | W | 100% | 0.0 |
| 11-25 | South Dakota (91.0) | Sum | N | 62-63 | W | 100% | 0.0 |
| 11-26 | Southern Miss (207.0) | CUSA | N | 77-63 | W | 100% | 0.0 |
| 11-29 | UC Davis (102.0) | BW | A | 56-51 | L | 0% | 0.0 |
| 12-13 | Denver (224.0) | Sum | H | 83-63 | W | 100% | 0.0 |
| 12-19 | Wyoming (98.0) | MWC | A | 84-91 | W | 100% | 0.0 |
| 12-22 | UNLV (134.0) | MWC | A | 94-91 | L | 0% | 0.0 |
| 12-29 | Eastern Washington (122.0) | BSky | H | 88-75 | W | 100% | 0.0 |
| 12-31 | Idaho (133.0) | BSky | H | 81-77 | W | 100% | 0.0 |
| 1-4 | Montana St. (283.0) | BSky | A | 76-64 | L | 0% | 0.0 |
| 1-6 | Montana (76.0) | BSky | A | 89-80 | L | 0% | 0.0 |
| 1-11 | Weber St. (162.0) | BSky | H | 74-78 | L | 0% | 0.0 |
| 1-13 | Idaho St. (268.0) | BSky | H | 94-80 | W | 100% | 0.0 |
| 1-20 | North Dakota (221.0) | BSky | H | 94-91 | W | 100% | 0.0 |
| 1-25 | Idaho (133.0) | BSky | A | 63-80 | W | 100% | 0.0 |
| 1-27 | Eastern Washington (122.0) | BSky | A | 67-65 | L | 0% | 0.0 |
| 2-1 | Montana (76.0) | BSky | H | 79-88 | L | 0% | 0.0 |
| 2-3 | Montana St. (283.0) | BSky | H | 86-63 | W | 100% | 0.0 |
| 2-8 | Idaho St. (268.0) | BSky | A | 82-85 | W | 100% | 0.0 |
| 2-10 | Weber St. (162.0) | BSky | A | 71-66 | L | 0% | 0.0 |
| 2-15 | Northern Arizona (310.0) | BSky | H | 95-60 | W | 100% | 0.0 |
| 2-17 | Southern Utah (252.0) | BSky | H | 97-80 | W | 100% | 0.0 |
| 2-24 | North Dakota (221.0) | BSky | A | 66-79 | W | 100% | 0.0 |
| 3-1 | Portland St. (170.0) | BSky | A | 78-85 | W | 100% | 0.0 |
| 3-3 | Sacramento St. (309.0) | BSky | A | 88-77 | L | 0% | 0.0 |
| 3-6 | Northern Arizona (310.0) | BSky | N | 82-59 | W | 100% | 0.0 |
| 3-8 | Weber St. (162.0) | BSky | N | 55-80 | W | 100% | 0.0 |
| 3-9 | Montana (76.0) | BSky | N | 91-89 | L | 0% | 0.0 |
| Team | Conf | Curr Wgt | Fut Wgt | Curr W/L | Exp W/L | Curr Impact | Exp Impact |
|---|---|---|---|---|---|---|---|
| Northern Colorado | BSky | 26.54 | 26.54 | 64.54 | 64.54 | 7.72 | 7.72 |
| Montana | BSky | 5.68 | 5.68 | 75.00 | 75.00 | 2.84 | 2.84 |
| Weber St. | BSky | 5.59 | 5.59 | 60.00 | 60.00 | 1.12 | 1.12 |
| North Dakota | BSky | 4.26 | 4.26 | 35.71 | 35.71 | -1.22 | -1.22 |
| Eastern Washington | BSky | 4.20 | 4.20 | 56.67 | 56.67 | 0.56 | 0.56 |
| Northern Arizona | BSky | 4.18 | 4.18 | 14.29 | 14.29 | -2.98 | -2.98 |
| Montana St. | BSky | 4.09 | 4.09 | 35.71 | 35.71 | -1.17 | -1.17 |
| Idaho St. | BSky | 4.07 | 4.07 | 46.15 | 46.15 | -0.31 | -0.31 |
| Idaho | BSky | 4.01 | 4.01 | 74.07 | 74.07 | 1.93 | 1.93 |
| UC Davis | BW | 3.25 | 3.25 | 64.29 | 64.29 | 0.93 | 0.93 |
| Southern Utah | BSky | 2.81 | 2.81 | 37.93 | 37.93 | -0.68 | -0.68 |
| Sacramento St. | BSky | 2.65 | 2.65 | 13.79 | 13.79 | -1.92 | -1.92 |
| Portland St. | BSky | 2.64 | 2.64 | 58.62 | 58.62 | 0.46 | 0.46 |
| South Dakota | Sum | 1.86 | 1.86 | 75.86 | 75.86 | 0.96 | 0.96 |
| Denver | Sum | 1.80 | 1.80 | 48.15 | 48.15 | -0.07 | -0.07 |
| Pepperdine | WCC | 1.73 | 1.73 | 16.67 | 16.67 | -1.15 | -1.15 |
| Youngstown St. | Horz | 1.72 | 1.72 | 20.69 | 20.69 | -1.01 | -1.01 |
| Wyoming | MWC | 1.72 | 1.72 | 61.29 | 61.29 | 0.39 | 0.39 |
| UNLV | MWC | 1.72 | 1.72 | 59.38 | 59.38 | 0.32 | 0.32 |
| Southern Miss | CUSA | 1.67 | 1.67 | 41.38 | 41.38 | -0.29 | -0.29 |
| Colorado | P12 | 1.64 | 1.64 | 51.61 | 51.61 | 0.05 | 0.05 |
| Cal St. Northridge | BW | 0.38 | 0.38 | 14.29 | 14.29 | -0.27 | -0.27 |
| UC Irvine | BW | 0.32 | 0.32 | 48.48 | 48.48 | -0.01 | -0.01 |
| Utah St. | MWC | 0.29 | 0.29 | 48.48 | 48.48 | -0.01 | -0.01 |
| UC Santa Barbara | BW | 0.29 | 0.29 | 70.00 | 70.00 | 0.12 | 0.12 |
| UC Riverside | BW | 0.29 | 0.29 | 24.14 | 24.14 | -0.15 | -0.15 |
| Oral Roberts | Sum | 0.27 | 0.27 | 28.57 | 28.57 | -0.12 | -0.12 |
| San Jose St. | MWC | 0.26 | 0.26 | 10.34 | 10.34 | -0.21 | -0.21 |
| Utah Valley | WAC | 0.25 | 0.25 | 65.52 | 65.52 | 0.08 | 0.08 |
| Nebraska Omaha | Sum | 0.25 | 0.25 | 24.14 | 24.14 | -0.13 | -0.13 |
| South Dakota St. | Sum | 0.24 | 0.24 | 80.00 | 80.00 | 0.15 | 0.15 |
| Fresno St. | MWC | 0.24 | 0.24 | 63.33 | 63.33 | 0.06 | 0.06 |
| Nevada | MWC | 0.23 | 0.23 | 79.41 | 79.41 | 0.14 | 0.14 |
| Washington | P12 | 0.23 | 0.23 | 62.50 | 62.50 | 0.06 | 0.06 |
| North Dakota St. | Sum | 0.22 | 0.22 | 41.38 | 41.38 | -0.04 | -0.04 |
| Washington St. | P12 | 0.22 | 0.22 | 38.71 | 38.71 | -0.05 | -0.05 |
| Santa Clara | WCC | 0.21 | 0.21 | 34.48 | 34.48 | -0.07 | -0.07 |
| Stanford | P12 | 0.21 | 0.21 | 54.55 | 54.55 | 0.02 | 0.02 |
| Pacific | WCC | 0.21 | 0.21 | 41.94 | 41.94 | -0.03 | -0.03 |
| BYU | WCC | 0.20 | 0.20 | 70.59 | 70.59 | 0.08 | 0.08 |
| Cal Poly | BW | 0.19 | 0.19 | 24.14 | 24.14 | -0.10 | -0.10 |
| Cal St. Fullerton | BW | 0.19 | 0.19 | 62.07 | 62.07 | 0.05 | 0.05 |
| Arizona St. | P12 | 0.19 | 0.19 | 64.52 | 64.52 | 0.05 | 0.05 |
| San Francisco | WCC | 0.18 | 0.18 | 53.12 | 53.12 | 0.01 | 0.01 |
| Cal St. Bakersfield | WAC | 0.16 | 0.16 | 33.33 | 33.33 | -0.05 | -0.05 |
| Hawaii | BW | 0.16 | 0.16 | 53.57 | 53.57 | 0.01 | 0.01 |
| Long Beach St. | BW | 0.16 | 0.16 | 41.94 | 41.94 | -0.03 | -0.03 |
| Arizona | P12 | 0.15 | 0.15 | 79.41 | 79.41 | 0.09 | 0.09 |
| Boise St. | MWC | 0.15 | 0.15 | 73.33 | 73.33 | 0.07 | 0.07 |
| Air Force | MWC | 0.15 | 0.15 | 34.48 | 34.48 | -0.05 | -0.05 |
| New Mexico | MWC | 0.15 | 0.15 | 54.55 | 54.55 | 0.01 | 0.01 |
| Arkansas Pine Bluff | SWAC | 0.14 | 0.14 | 40.00 | 40.00 | -0.03 | -0.03 |
| San Diego | WCC | 0.13 | 0.13 | 56.67 | 56.67 | 0.02 | 0.02 |
| Georgia St. | SB | 0.13 | 0.13 | 68.75 | 68.75 | 0.05 | 0.05 |
| Colorado St. | MWC | 0.13 | 0.13 | 32.26 | 32.26 | -0.05 | -0.05 |
| San Diego St. | MWC | 0.13 | 0.13 | 67.74 | 67.74 | 0.04 | 0.04 |
| Utah | P12 | 0.13 | 0.13 | 63.33 | 63.33 | 0.03 | 0.03 |
| Fort Wayne | Sum | 0.11 | 0.11 | 50.00 | 50.00 | 0.00 | 0.00 |
| Western Illinois | Sum | 0.11 | 0.11 | 33.33 | 33.33 | -0.04 | -0.04 |
| Seattle | WAC | 0.11 | 0.11 | 56.67 | 56.67 | 0.01 | 0.01 |
| Louisiana Tech | CUSA | 0.11 | 0.11 | 48.39 | 48.39 | -0.00 | -0.00 |
| Milwaukee | Horz | 0.11 | 0.11 | 48.39 | 48.39 | -0.00 | -0.00 |
| Gonzaga | WCC | 0.11 | 0.11 | 88.24 | 88.24 | 0.08 | 0.08 |
| Portland | WCC | 0.11 | 0.11 | 24.14 | 24.14 | -0.05 | -0.05 |
| Saint Mary's | WCC | 0.10 | 0.10 | 84.85 | 84.85 | 0.07 | 0.07 |
| Bradley | MVC | 0.09 | 0.09 | 59.38 | 59.38 | 0.02 | 0.02 |
| Iona | MAAC | 0.09 | 0.09 | 60.61 | 60.61 | 0.02 | 0.02 |
| James Madison | CAA | 0.09 | 0.09 | 29.03 | 29.03 | -0.04 | -0.04 |
| Central Michigan | MAC | 0.08 | 0.08 | 53.33 | 53.33 | 0.01 | 0.01 |
| Cleveland St. | Horz | 0.08 | 0.08 | 32.35 | 32.35 | -0.03 | -0.03 |
| Middle Tennessee | CUSA | 0.08 | 0.08 | 76.67 | 76.67 | 0.04 | 0.04 |
| Troy | SB | 0.08 | 0.08 | 45.16 | 45.16 | -0.01 | -0.01 |
| Loyola Marymount | WCC | 0.08 | 0.08 | 33.33 | 33.33 | -0.03 | -0.03 |
| Penn St. | B10 | 0.08 | 0.08 | 61.76 | 61.76 | 0.02 | 0.02 |
| Pittsburgh | ACC | 0.08 | 0.08 | 25.00 | 25.00 | -0.04 | -0.04 |
| Drake | MVC | 0.08 | 0.08 | 48.39 | 48.39 | -0.00 | -0.00 |
| Oregon St. | P12 | 0.08 | 0.08 | 50.00 | 50.00 | 0.00 | 0.00 |
| UCLA | P12 | 0.08 | 0.08 | 65.62 | 65.62 | 0.02 | 0.02 |
| Nicholls St. | Slnd | 0.06 | 0.06 | 60.71 | 60.71 | 0.01 | 0.01 |
| Sam Houston St. | Slnd | 0.06 | 0.06 | 51.72 | 51.72 | 0.00 | 0.00 |
| Western Michigan | MAC | 0.06 | 0.06 | 50.00 | 50.00 | 0.00 | 0.00 |
| Binghamton | AE | 0.05 | 0.05 | 31.03 | 31.03 | -0.02 | -0.02 |
| Butler | BE | 0.05 | 0.05 | 60.61 | 60.61 | 0.01 | 0.01 |
| Creighton | BE | 0.05 | 0.05 | 64.52 | 64.52 | 0.02 | 0.02 |
| Detroit | Horz | 0.05 | 0.05 | 20.00 | 20.00 | -0.03 | -0.03 |
| Duke | ACC | 0.05 | 0.05 | 78.79 | 78.79 | 0.03 | 0.03 |
| FIU | CUSA | 0.05 | 0.05 | 37.93 | 37.93 | -0.01 | -0.01 |
| Green Bay | Horz | 0.05 | 0.05 | 33.33 | 33.33 | -0.02 | -0.02 |
| Hampton | MEAC | 0.05 | 0.05 | 51.61 | 51.61 | 0.00 | 0.00 |
| Illinois Chicago | Horz | 0.05 | 0.05 | 50.00 | 50.00 | 0.00 | 0.00 |
| IUPUI | Horz | 0.05 | 0.05 | 32.14 | 32.14 | -0.02 | -0.02 |
| Jacksonville | ASun | 0.05 | 0.05 | 37.93 | 37.93 | -0.01 | -0.01 |
| Kansas St. | B12 | 0.05 | 0.05 | 66.67 | 66.67 | 0.02 | 0.02 |
| Lamar | Slnd | 0.05 | 0.05 | 53.57 | 53.57 | 0.00 | 0.00 |
| Marshall | CUSA | 0.05 | 0.05 | 69.70 | 69.70 | 0.02 | 0.02 |
| Nebraska | B10 | 0.05 | 0.05 | 68.75 | 68.75 | 0.02 | 0.02 |
| Northern Kentucky | Horz | 0.05 | 0.05 | 68.97 | 68.97 | 0.02 | 0.02 |
| Oakland | Horz | 0.05 | 0.05 | 57.58 | 57.58 | 0.01 | 0.01 |
| Radford | BSth | 0.05 | 0.05 | 62.50 | 62.50 | 0.01 | 0.01 |
| South Florida | Amer | 0.05 | 0.05 | 31.25 | 31.25 | -0.02 | -0.02 |
| Southeast Missouri St. | OVC | 0.05 | 0.05 | 41.38 | 41.38 | -0.01 | -0.01 |
| UAB | CUSA | 0.05 | 0.05 | 58.06 | 58.06 | 0.01 | 0.01 |
| UTEP | CUSA | 0.05 | 0.05 | 33.33 | 33.33 | -0.02 | -0.02 |
| UTSA | CUSA | 0.05 | 0.05 | 53.33 | 53.33 | 0.00 | 0.00 |
| Wright St. | Horz | 0.05 | 0.05 | 71.88 | 71.88 | 0.02 | 0.02 |
| California | P12 | 0.05 | 0.05 | 25.81 | 25.81 | -0.03 | -0.03 |
| Iowa | B10 | 0.05 | 0.05 | 42.42 | 42.42 | -0.01 | -0.01 |
| Oregon | P12 | 0.05 | 0.05 | 64.71 | 64.71 | 0.02 | 0.02 |
| Rice | CUSA | 0.05 | 0.05 | 17.24 | 17.24 | -0.03 | -0.03 |
| Eastern Kentucky | OVC | 0.05 | 0.05 | 31.03 | 31.03 | -0.02 | -0.02 |
| USC | P12 | 0.05 | 0.05 | 67.65 | 67.65 | 0.02 | 0.02 |
| Florida Gulf Coast | ASun | 0.03 | 0.03 | 64.52 | 64.52 | 0.01 | 0.01 |
| Navy | Pat | 0.03 | 0.03 | 61.29 | 61.29 | 0.01 | 0.01 |
| St. Francis NY | NEC | 0.03 | 0.03 | 37.93 | 37.93 | -0.01 | -0.01 |
| USC Upstate | ASun | 0.03 | 0.03 | 10.71 | 10.71 | -0.02 | -0.02 |
| Alabama A&M | SWAC | 0.03 | 0.03 | 9.68 | 9.68 | -0.02 | -0.02 |
| Bowling Green | MAC | 0.03 | 0.03 | 46.67 | 46.67 | -0.00 | -0.00 |
| Canisius | MAAC | 0.03 | 0.03 | 65.62 | 65.62 | 0.01 | 0.01 |
| Charlotte | CUSA | 0.03 | 0.03 | 17.86 | 17.86 | -0.02 | -0.02 |
| DePaul | BE | 0.03 | 0.03 | 35.48 | 35.48 | -0.01 | -0.01 |
| Florida Atlantic | CUSA | 0.03 | 0.03 | 32.14 | 32.14 | -0.01 | -0.01 |
| Florida St. | ACC | 0.03 | 0.03 | 64.52 | 64.52 | 0.01 | 0.01 |
| Grambling St. | SWAC | 0.03 | 0.03 | 53.33 | 53.33 | 0.00 | 0.00 |
| Indiana | B10 | 0.03 | 0.03 | 51.61 | 51.61 | 0.00 | 0.00 |
| Kent St. | MAC | 0.03 | 0.03 | 48.48 | 48.48 | -0.00 | -0.00 |
| Michigan | B10 | 0.03 | 0.03 | 79.41 | 79.41 | 0.02 | 0.02 |
| Michigan St. | B10 | 0.03 | 0.03 | 87.88 | 87.88 | 0.02 | 0.02 |
| Mississippi St. | SEC | 0.03 | 0.03 | 65.62 | 65.62 | 0.01 | 0.01 |
| North Texas | CUSA | 0.03 | 0.03 | 43.33 | 43.33 | -0.00 | -0.00 |
| Old Dominion | CUSA | 0.03 | 0.03 | 78.12 | 78.12 | 0.02 | 0.02 |
| Robert Morris | NEC | 0.03 | 0.03 | 48.48 | 48.48 | -0.00 | -0.00 |
| Saint Joseph's | A10 | 0.03 | 0.03 | 50.00 | 50.00 | 0.00 | 0.00 |
| South Alabama | SB | 0.03 | 0.03 | 40.00 | 40.00 | -0.01 | -0.01 |
| TCU | B12 | 0.03 | 0.03 | 65.62 | 65.62 | 0.01 | 0.01 |
| UMKC | WAC | 0.03 | 0.03 | 27.59 | 27.59 | -0.01 | -0.01 |
| Western Kentucky | CUSA | 0.03 | 0.03 | 69.70 | 69.70 | 0.01 | 0.01 |
| Belmont | OVC | 0.03 | 0.03 | 72.73 | 72.73 | 0.01 | 0.01 |
| Oklahoma St. | B12 | 0.03 | 0.03 | 57.58 | 57.58 | 0.00 | 0.00 |
| Texas A&M | SEC | 0.03 | 0.03 | 62.50 | 62.50 | 0.01 | 0.01 |
| Chattanooga | SC | 0.03 | 0.03 | 25.81 | 25.81 | -0.01 | -0.01 |
| Cincinnati | Amer | 0.03 | 0.03 | 88.24 | 88.24 | 0.02 | 0.02 |
| Louisiana Lafayette | SB | 0.03 | 0.03 | 80.65 | 80.65 | 0.02 | 0.02 |
| Mercer | SC | 0.03 | 0.03 | 53.33 | 53.33 | 0.00 | 0.00 |
| Quinnipiac | MAAC | 0.03 | 0.03 | 36.36 | 36.36 | -0.01 | -0.01 |
| South Carolina | SEC | 0.03 | 0.03 | 50.00 | 50.00 | 0.00 | 0.00 |
| Texas Southern | SWAC | 0.03 | 0.03 | 44.12 | 44.12 | -0.00 | -0.00 |
| Xavier | BE | 0.03 | 0.03 | 84.85 | 84.85 | 0.02 | 0.02 |
| Florida A&M | MEAC | 0.02 | 0.02 | 24.24 | 24.24 | -0.01 | -0.01 |
| Illinois | B10 | 0.02 | 0.02 | 41.94 | 41.94 | -0.00 | -0.00 |
| Mississippi Valley St. | SWAC | 0.02 | 0.02 | 12.50 | 12.50 | -0.02 | -0.02 |
| Northern Iowa | MVC | 0.02 | 0.02 | 46.67 | 46.67 | -0.00 | -0.00 |
| Prairie View A&M | SWAC | 0.02 | 0.02 | 45.45 | 45.45 | -0.00 | -0.00 |